Klima Carnlough
Klimatabellen und Klimadiagramme Carnlough, Irland
Klima Carnlough
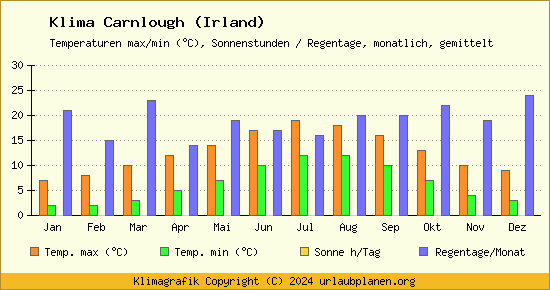
Temperaturen, Sonnenstunden und Regentage
Temperaturen, Sonnenstunden und Regentage

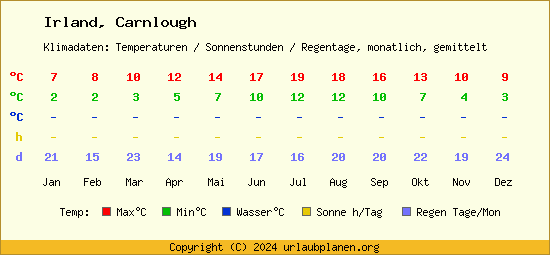
Klimatabelle für Urlaub in Carnlough
Temperatur, Sonne, Regen
Temperatur, Sonne, Regen

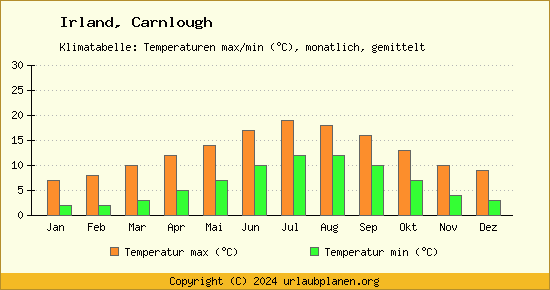
Carnlough Temperaturen - Luft, Wasser
Lufttemperatur, Wassertemperatur
Lufttemperatur, Wassertemperatur

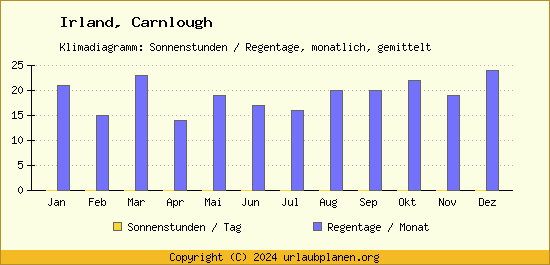
Carnlough Klimadiagramm - Sonne, Regen
Klima: Regentage, Sonnenstunden
Klima: Regentage, Sonnenstunden

Zurück zu: Klima Irland
Klimadaten Irland - Klimadiagramme, Klimatabellen für:
A Ã B C D E F G H I K L M N O P R S T V W Y
Caherdaniel
Cahersiveen
Cahir
Carick on Shannon
Carlingford
Carlington
Carlow
Carna
Carnlough
Carrig on Bannow
Carrigaline
Carrigallen
Cashel
Castlebar
Castleconnell
Castledermet
Castlegregory
Castlemartyr
Cathair SaidhbhÃn
Cavan
Charlestown
Cill Droichid
Clare
Claremorris
Clarinbridge
Clifden
Clonakilty
Clondalkin
Clondra
Clonmel
Co Carlow
Co Cork
Cobh
Cong
Connemara
Coolaney
Coolbeg Cross
Cork
Corrandulla
Courtown Harbour
Cunnamore Point
Curry
Angezeigt wird das Reiseklima Carnlough (gemittelte Messwerte für die Wetter- und Klimadaten) für die Monate Januar, Februar, März, April, Mai, Juni, Juli und August sowie September, Oktober, November und Dezember (jeweils die Durchschnittstemperatur Carnlough (Irland)).
Afrika
Asien
Australien / Ozeanien
Europa
Reiseplanung Hauptstadtwetter Klima Landkarten Reisen Reiseziele Sehenswürdigkeiten Stadtkarten / Inseln Urlaub planen Video / TV Wettervorhersage
Datenschutz Sitemap Suche
- Bulgarien
- Dänemark
- Deutschland
- Finnland
- Frankreich
- Griechenland
- Großbritannien
- Irland
- Italien
- Kroatien
- Malta
- Norwegen
- Österreich
- Portugal
- Rumänien
- Schweden
- Schweiz
- Spanien
- Ungarn
Reiseplanung Hauptstadtwetter Klima Landkarten Reisen Reiseziele Sehenswürdigkeiten Stadtkarten / Inseln Urlaub planen Video / TV Wettervorhersage
Datenschutz Sitemap Suche
© 2006-2024 Webstart Service - Seite: Klima Carnlough / Irland - Klimatabelle Carnlough Klimadiagramm - 18.07.2024 (689) Optimiert von rankseek.com
